Albert Einstein was on to something! He helped develop an experiment called the EPR paradox, which explained the Copenhagen interpretation.*
It’s a physics experiment that deals with a crazy thing called “quantum entanglement.”
Without turning my health blog into a science class let me explain what quantum entanglement means. Basically it’s when you look at and actually measure something, it changes its very nature and outcome. So the very act of attempting to measure matter or even observe it actually changes the matter. Einstein called this the “spooky action at a distance.”
So on a quantum level it’s a proven fact that when you look at or measure something you physically change the possible outcome. And that’s what I want to talk about today.
Personal Metrics – the measurement of things directly related to your life.
With weight loss and measuring, there are usually just two types of measurements that the average person looks at. The first is the use of a scale to measure our weight. Secondly if we want more information we might use a tape measure to gauge the amount of inches we are round. Most people never go any further than that when it comes to metrics.
I want to encourage you to begin examining the idea of adding some new types of metrics into your daily life. Let me explain why it’s important for weight loss and your overall health
Below is a graph that I developed to help illustrate my point. This graph represents the health and fitness levels of the average American population in 1930.
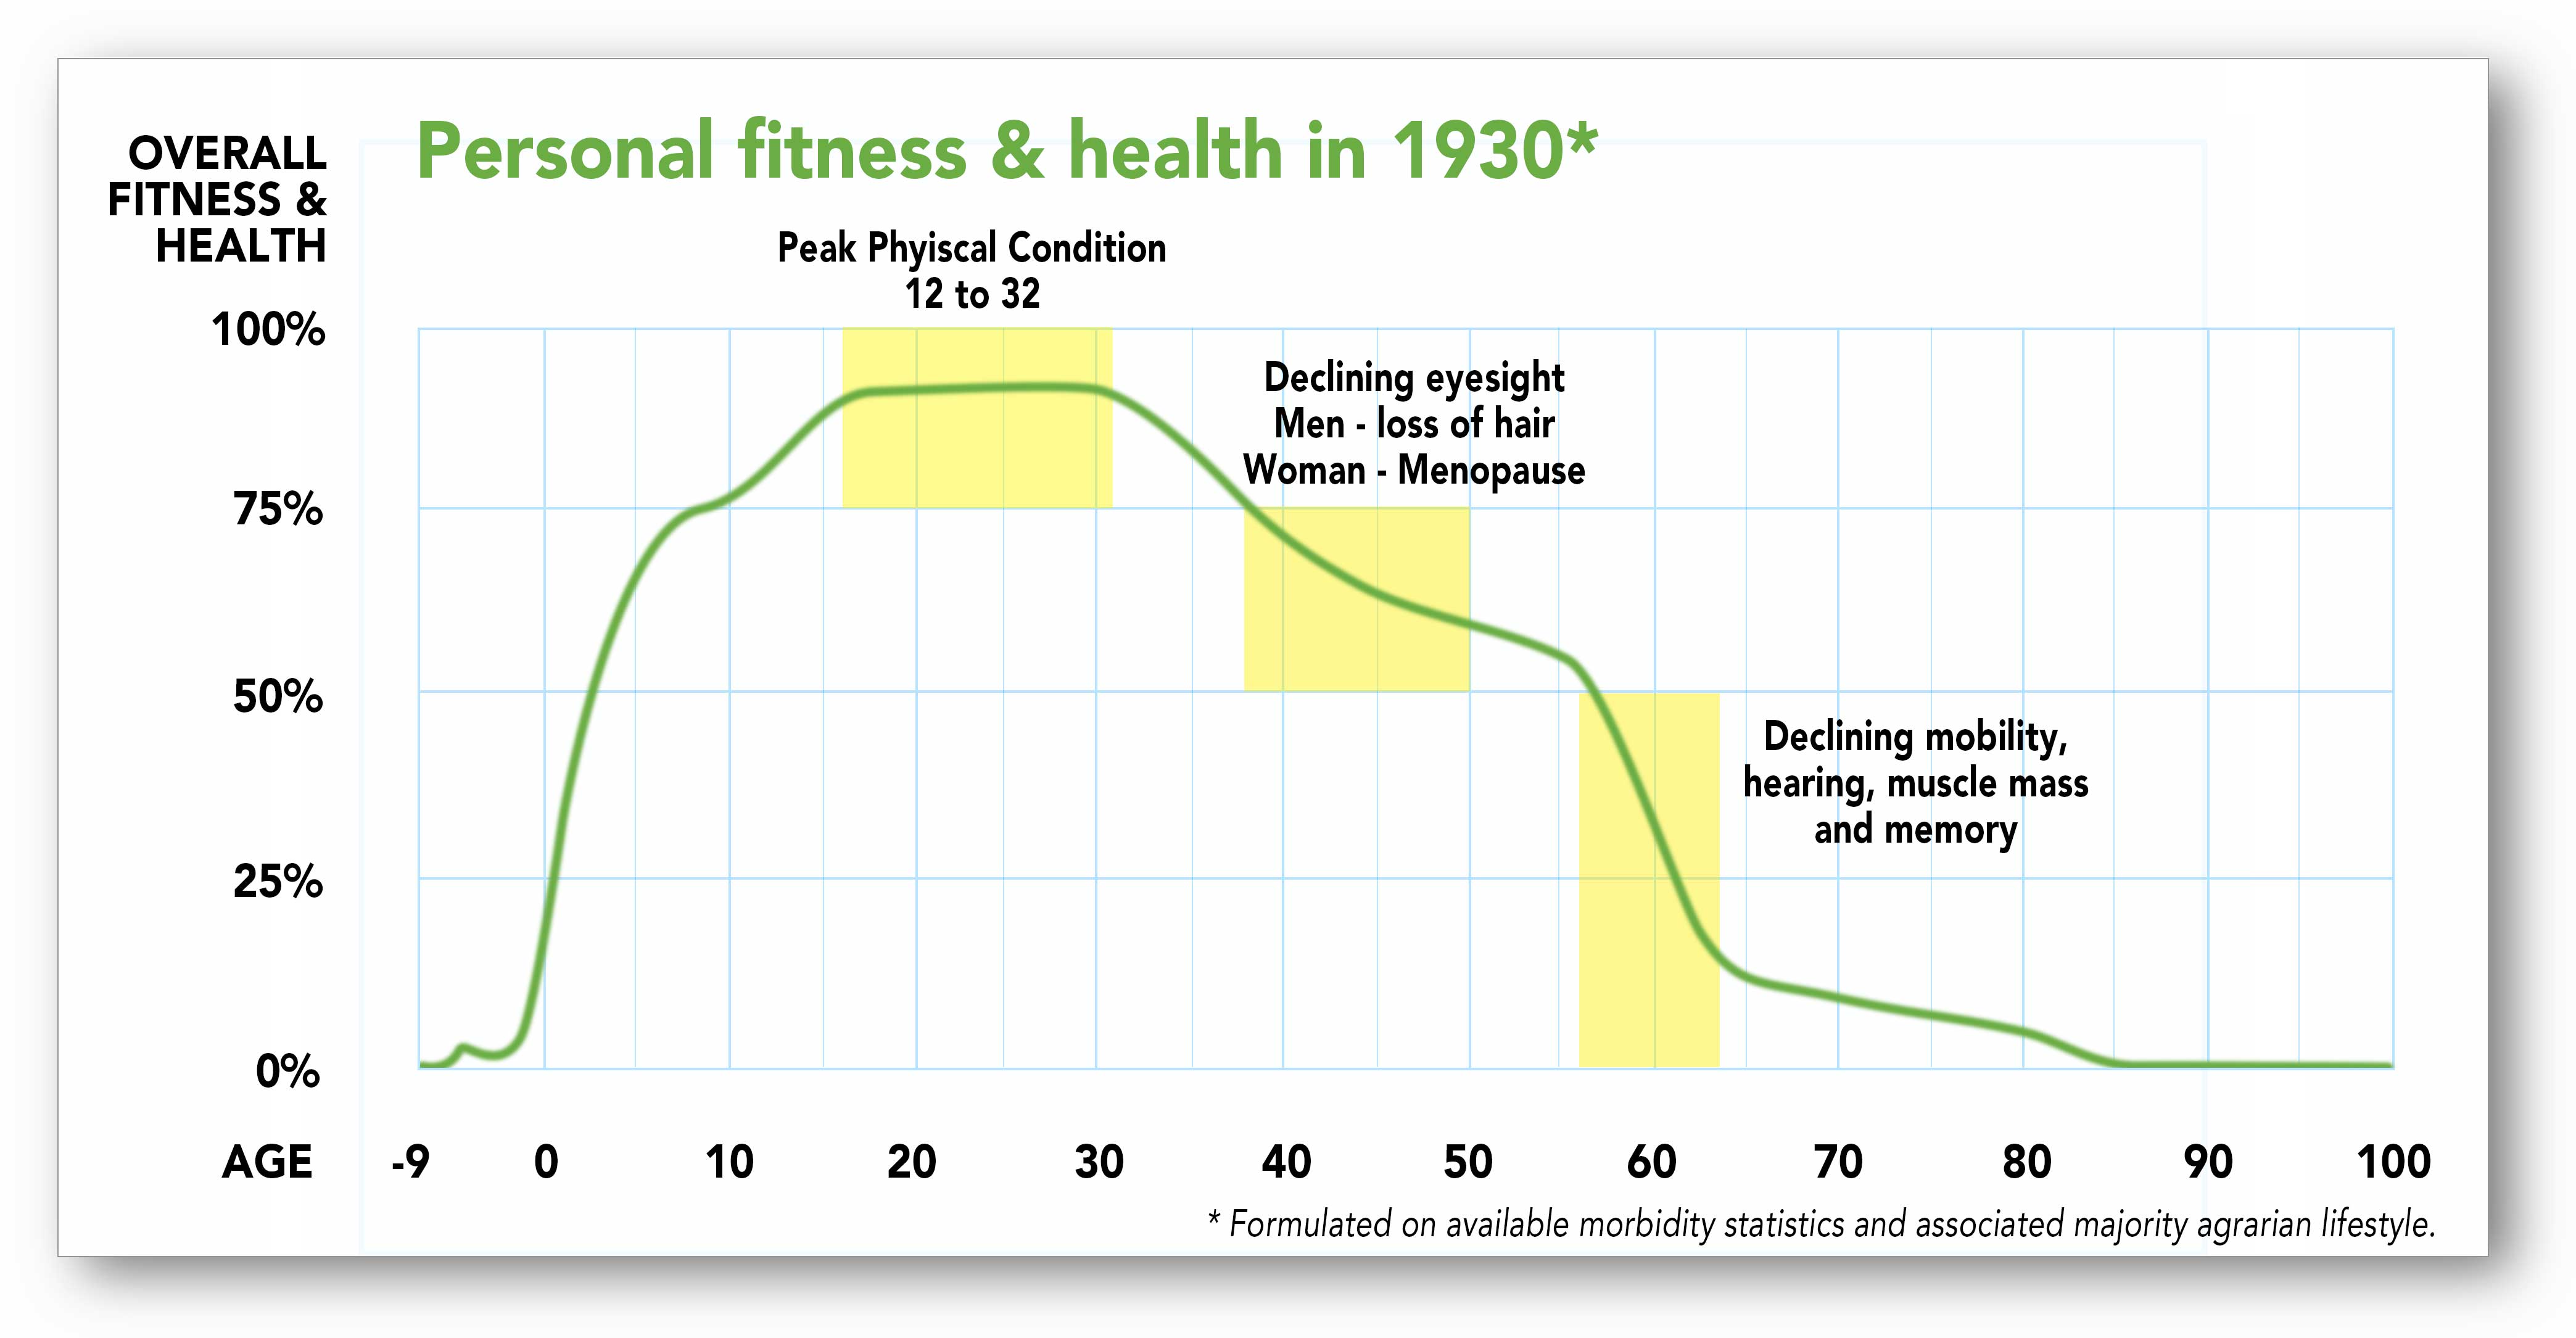
Notice that in those days the mortality of the unborn and children was very high. But when you look at the overall health and fitness of the people of that time it was quite remarkable. I believe this was possibly attributed to the agrarian lifestyle featuring more sleep and physical activity and a diet of less salt, sugar and more fresh non-processed foods.
Now let’s look at a graph of the “Perceived” health and fitness levels of the average American in 2013.
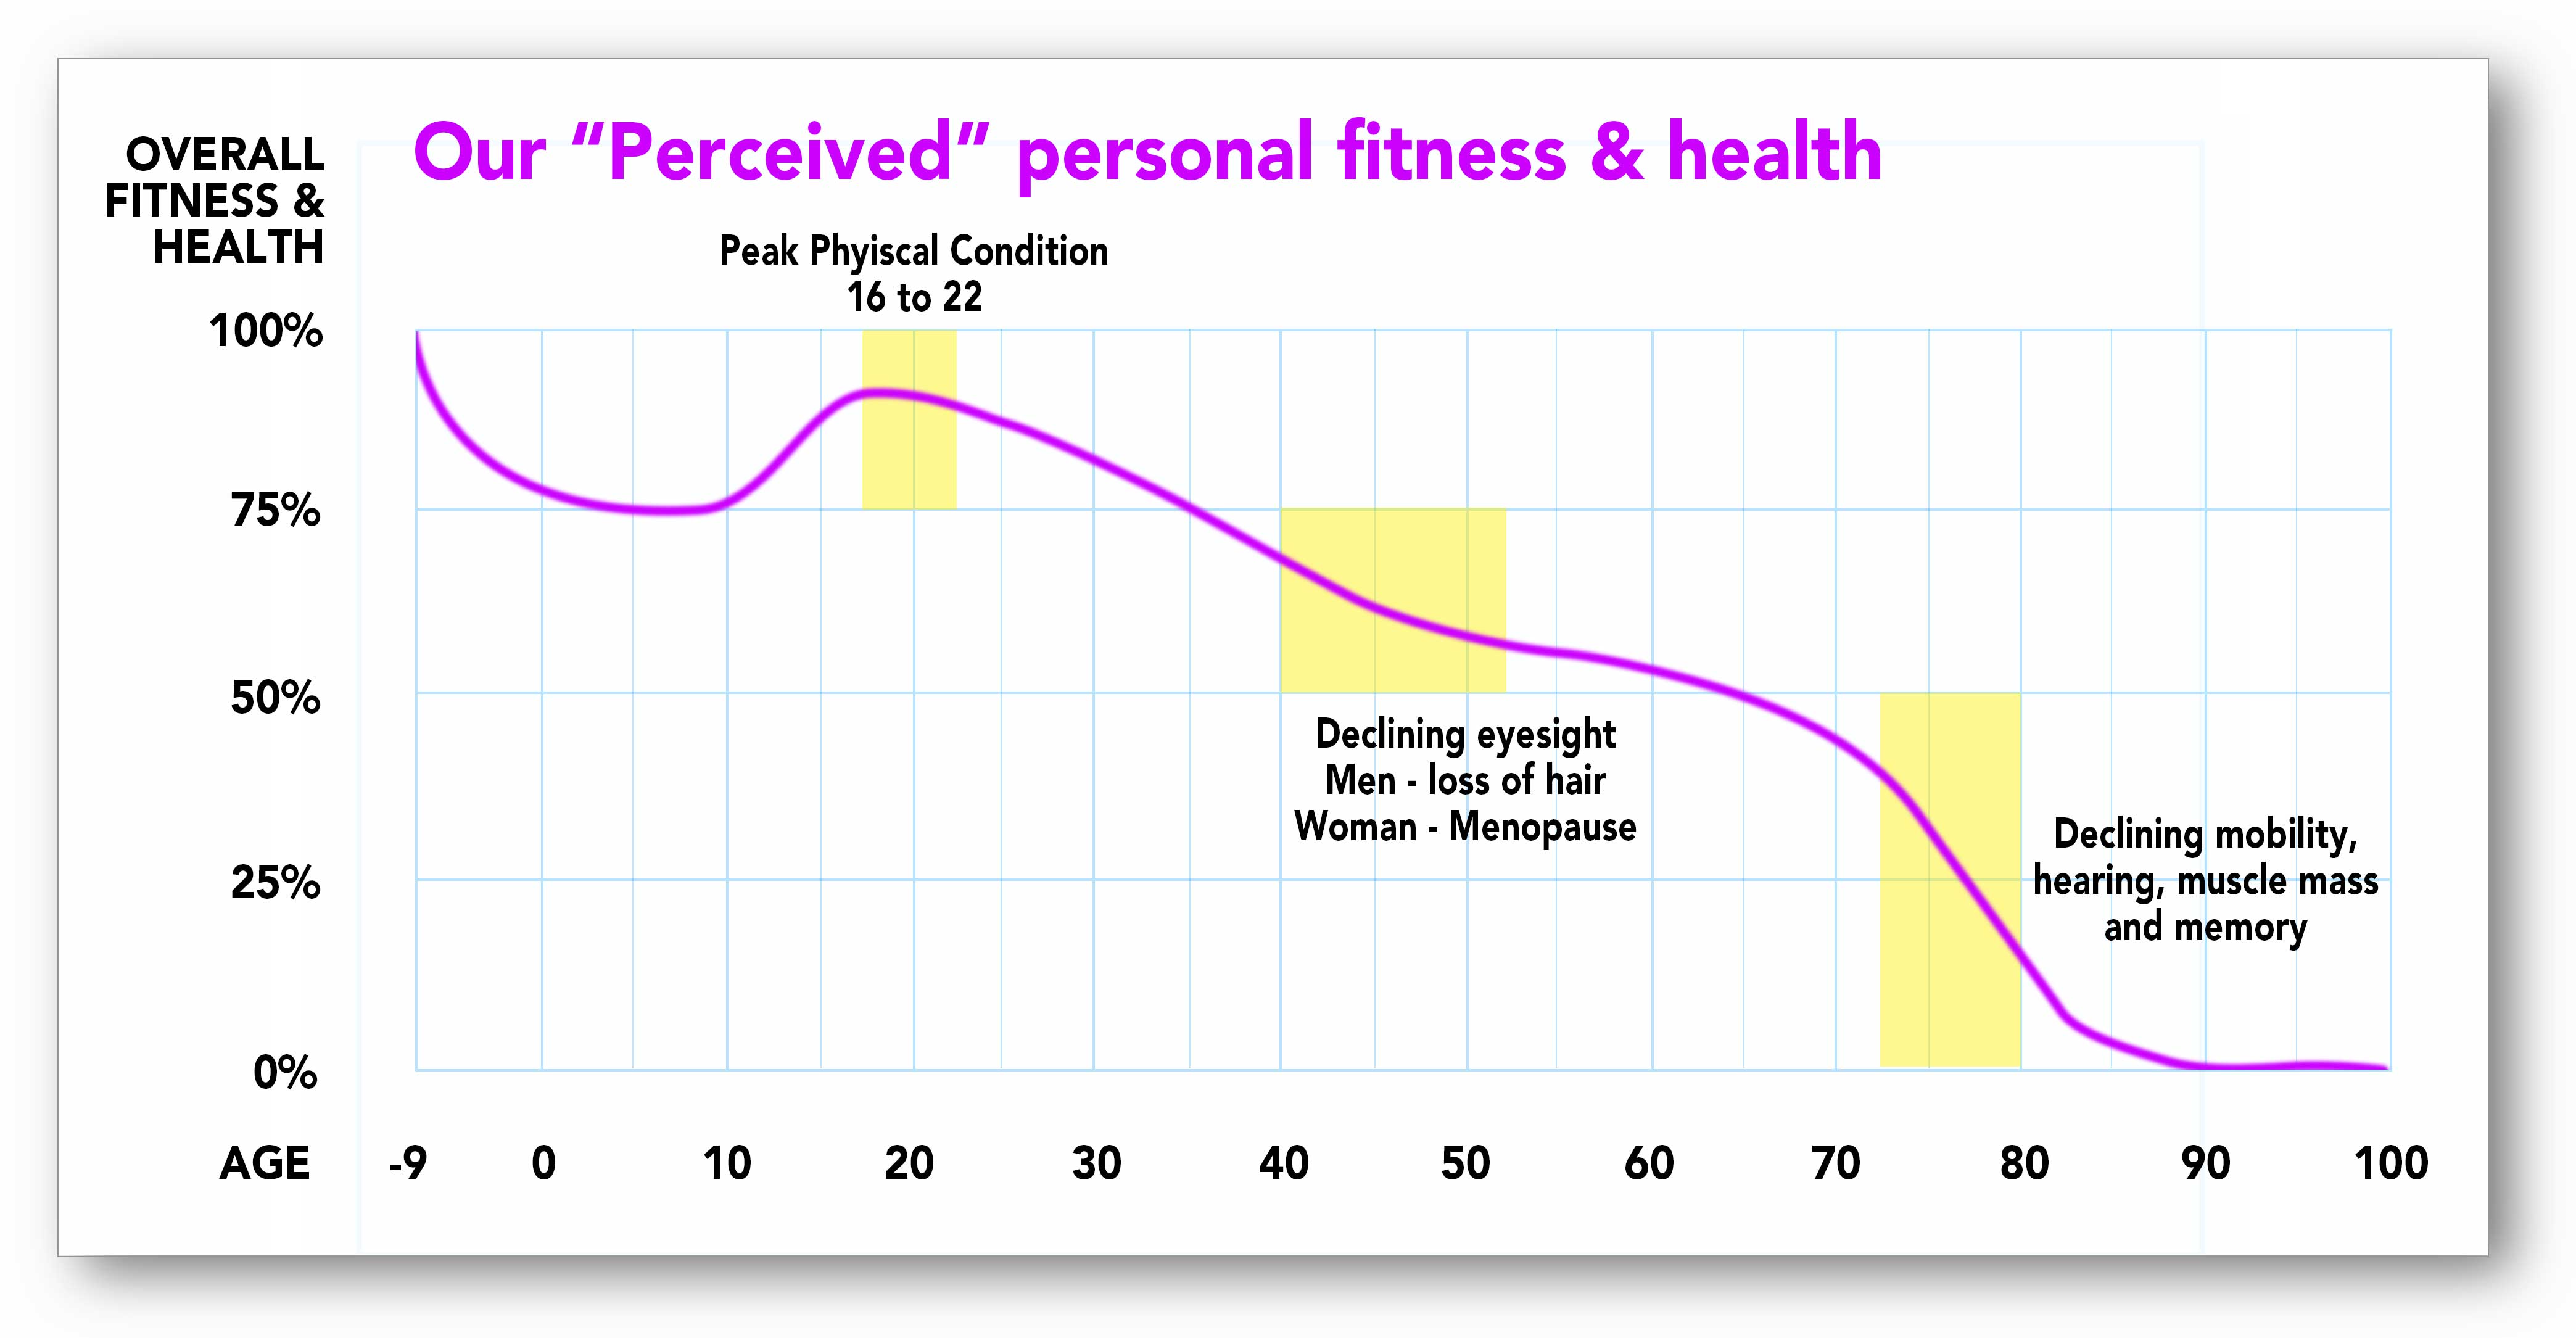
You will see we think we start out in perfect health then our overall health and fitness level peaks from 16 to 22 years old. It gradually declines over the next 70 years. You need to understand that when it comes to our personal fitness and health we all tend to deceive ourselves a little and create a more acceptable path of aging.
Now let’s take a look at the “Reality” of what our health actually looks like.
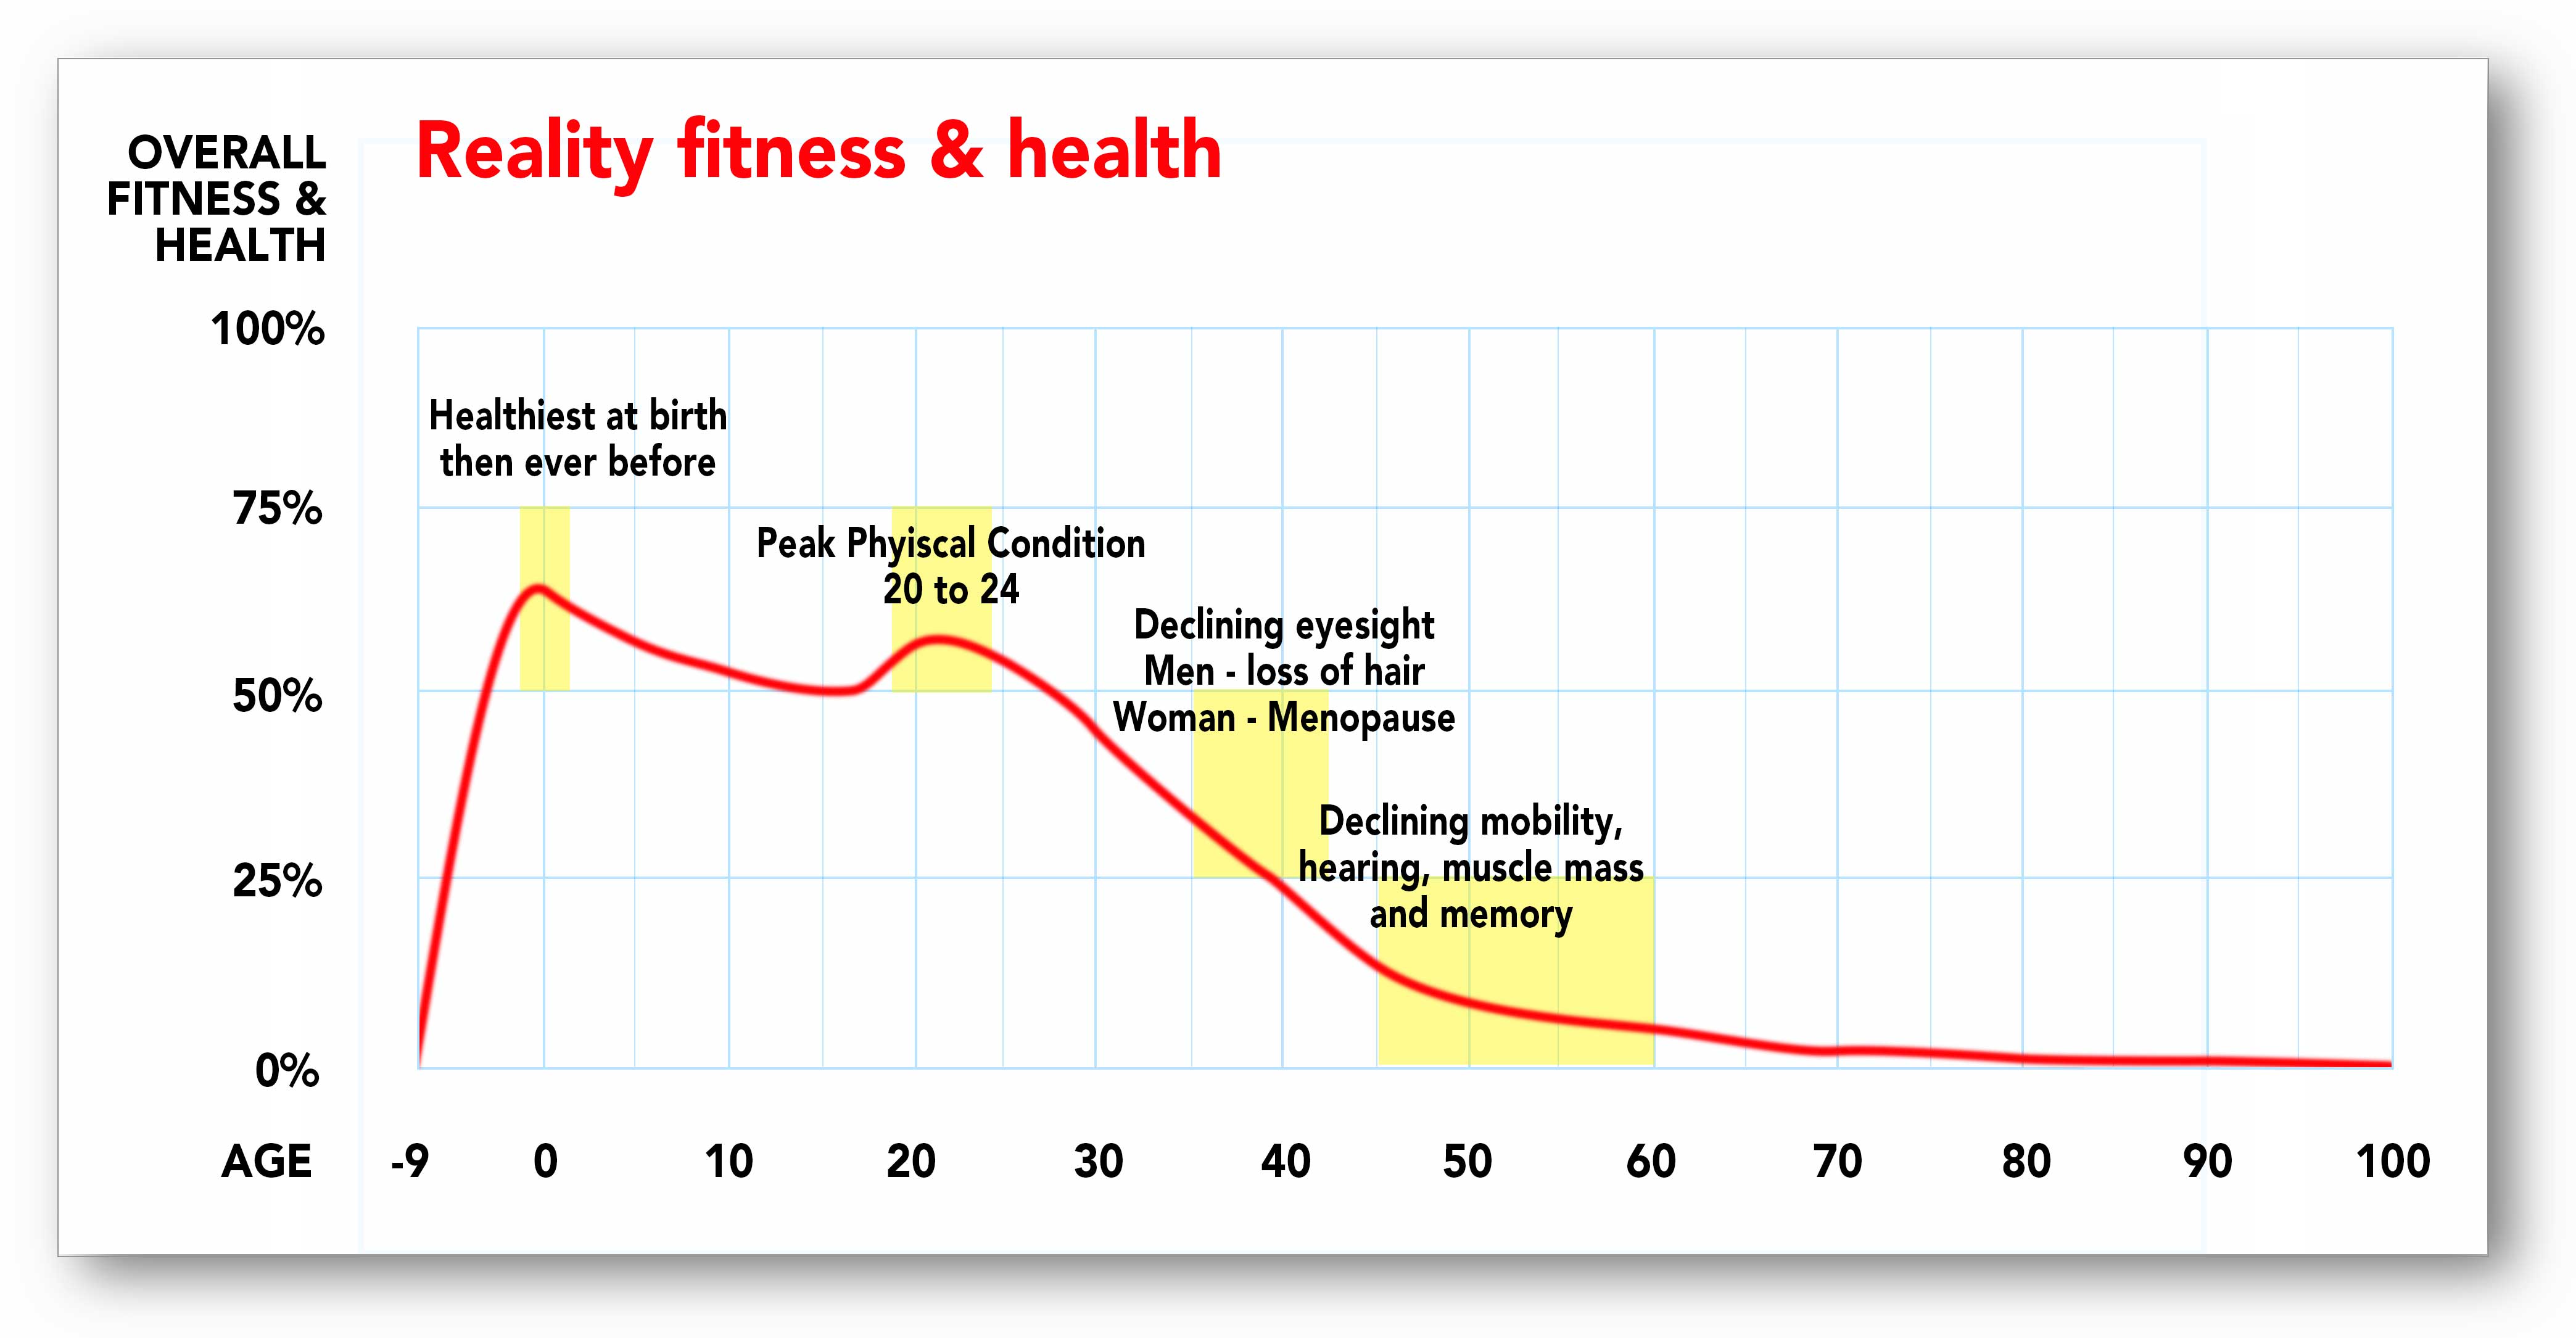
In this graph you’ll see we are the healthiest at birth than ever before in the history of the world. Upon further examination, we never get close to reaching even 75% of our fitness and health potential. Our peak physical conditioning has shifted to be between 20 and 24 years old. Consider the dramatic downhill run into the decline of accepted old age.
When you lay these graphs over each other you can see the marked difference between our past, our perception and our reality when it comes to our fitness and health levels.
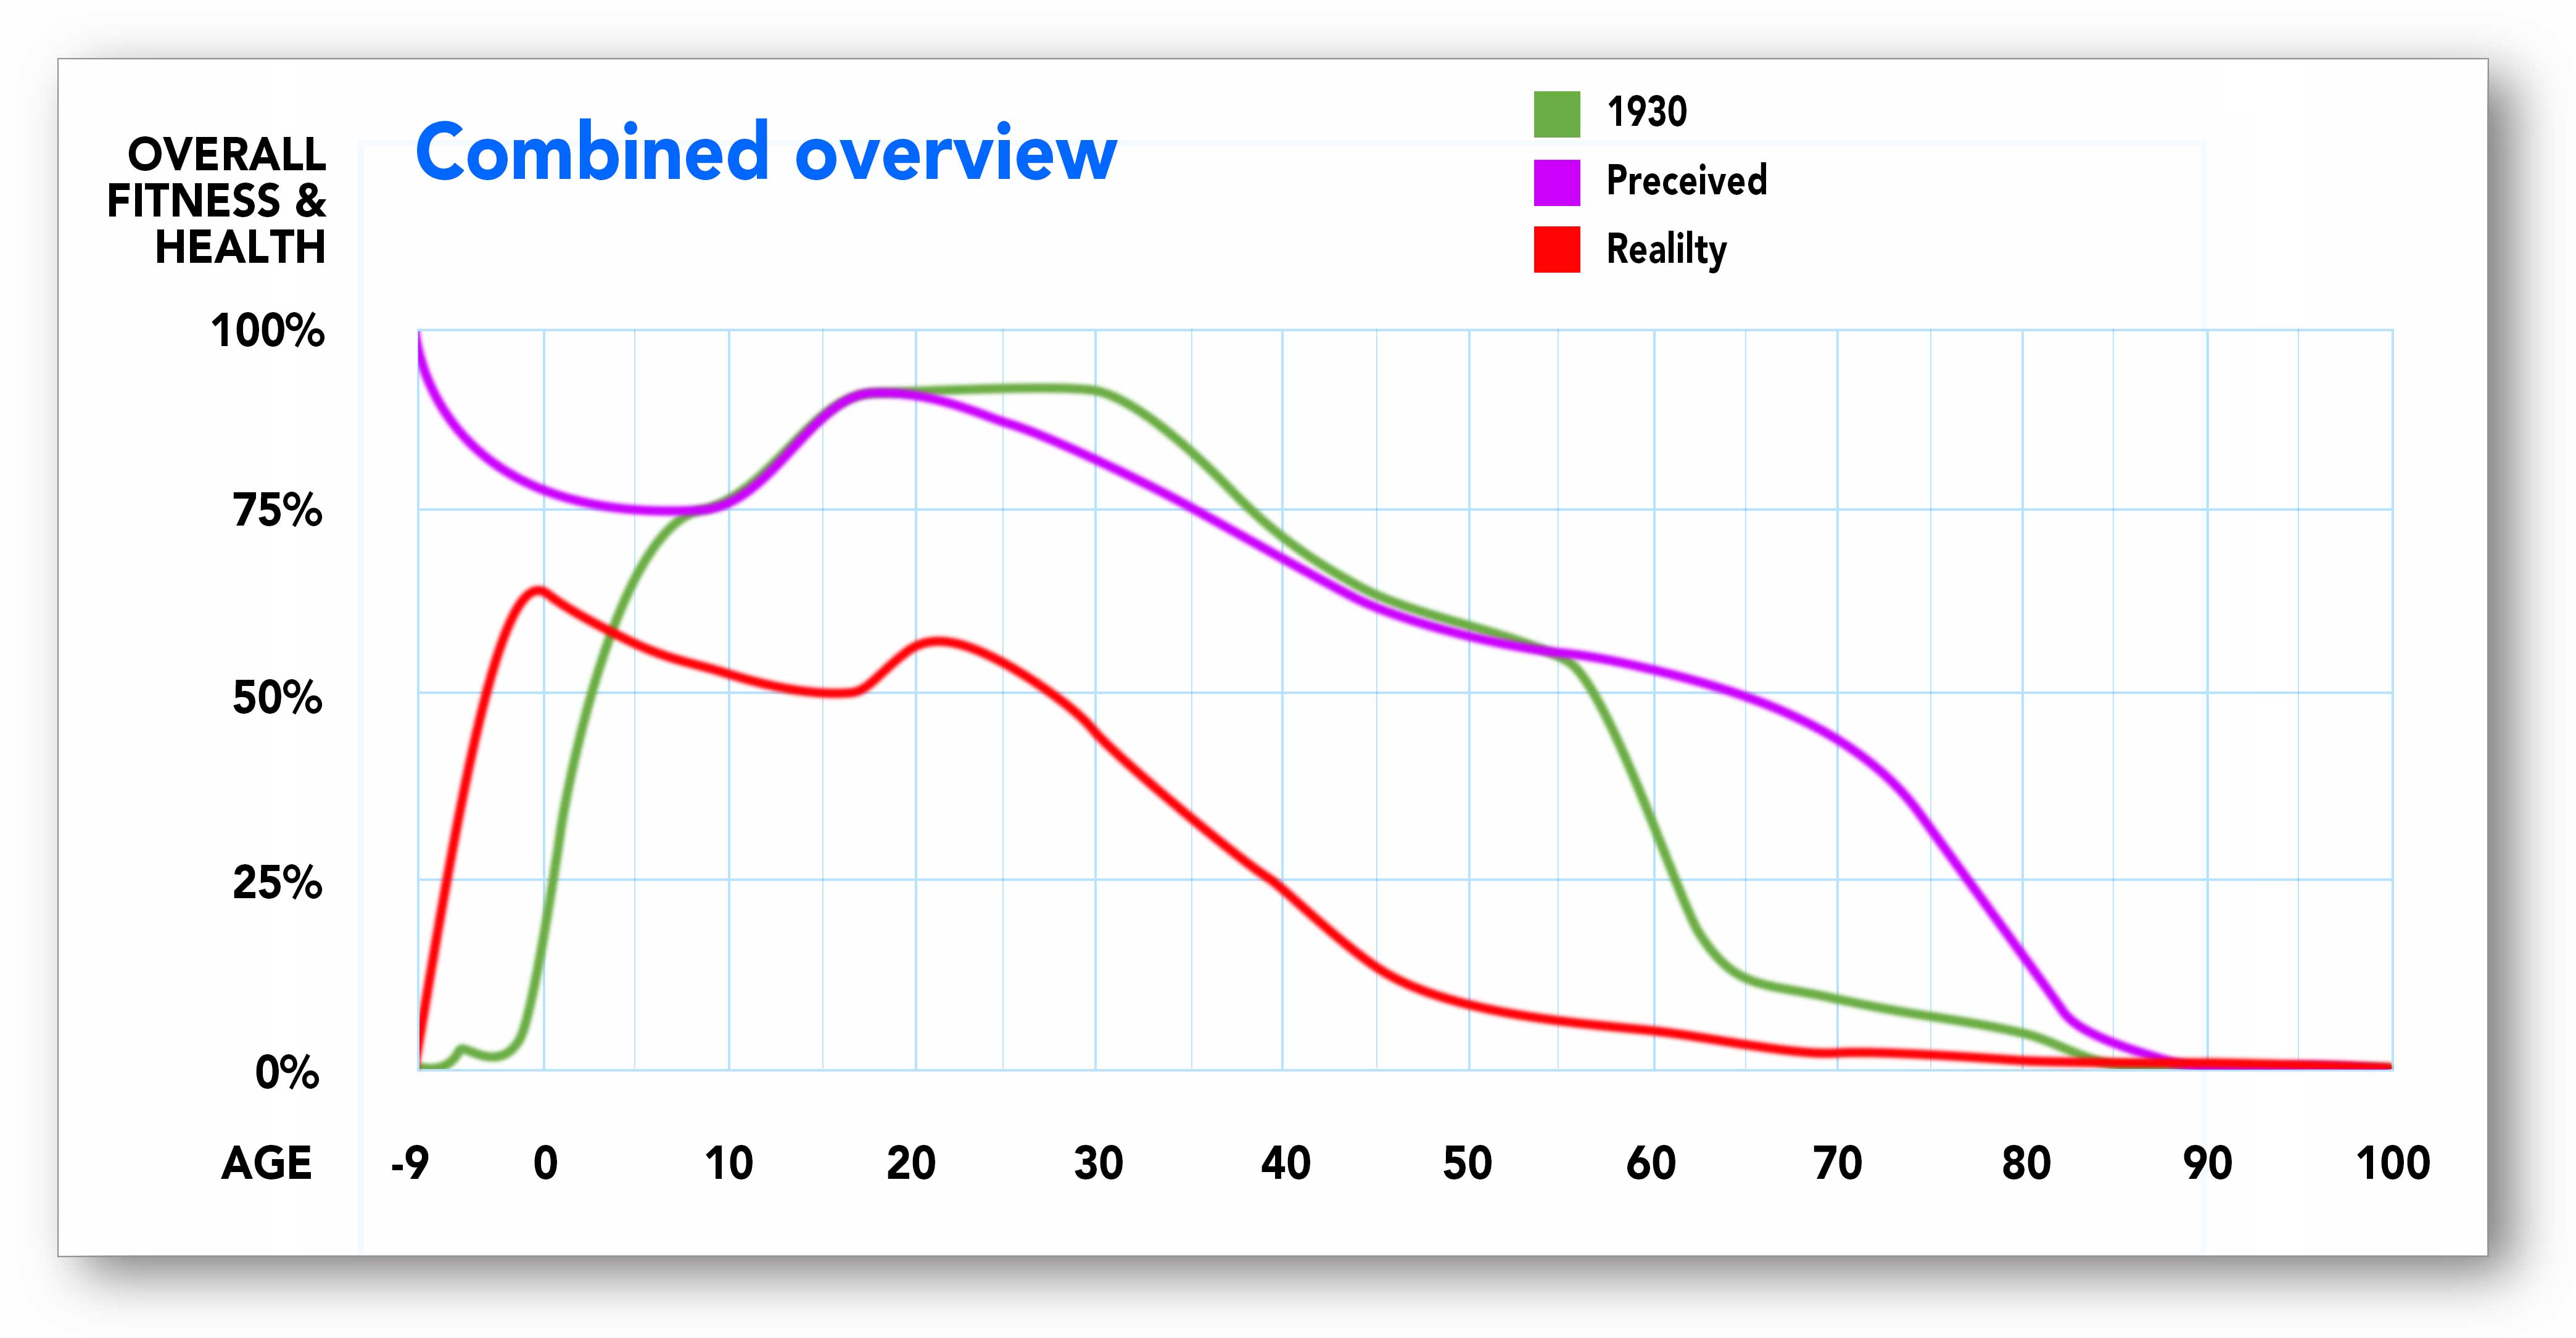
Actually seeing the measured aspects of our overall fitness and health can be a startling wake-up call. Clearly the difference between our current perception and our reality is wildly skewed.
So how can metrics change your future outcome when it comes to your personal overall fitness and health?
Several years ago I recognized the vital role metrics can play in improving my health. I began implementing many different types of metrics into my daily lifestyle. I began recording and measuring things as varied as the foods I ate, the time of day, which restaurants I ate at, and how often.
I measured when I went to sleep and what time I awoke. I recorded my moods and emotions. I would do blood work to examine hormones, vitamins and minerals, cholesterol and other vital sign posts to my overall health at quarterly intervals.
Having all of these metrics allowed me to discover hidden patterns, and flaws in my perception as well as highlighting my progress and improvements to my overall health and fitness.
Here is just one of my graphs that coincides with the other graphs above.
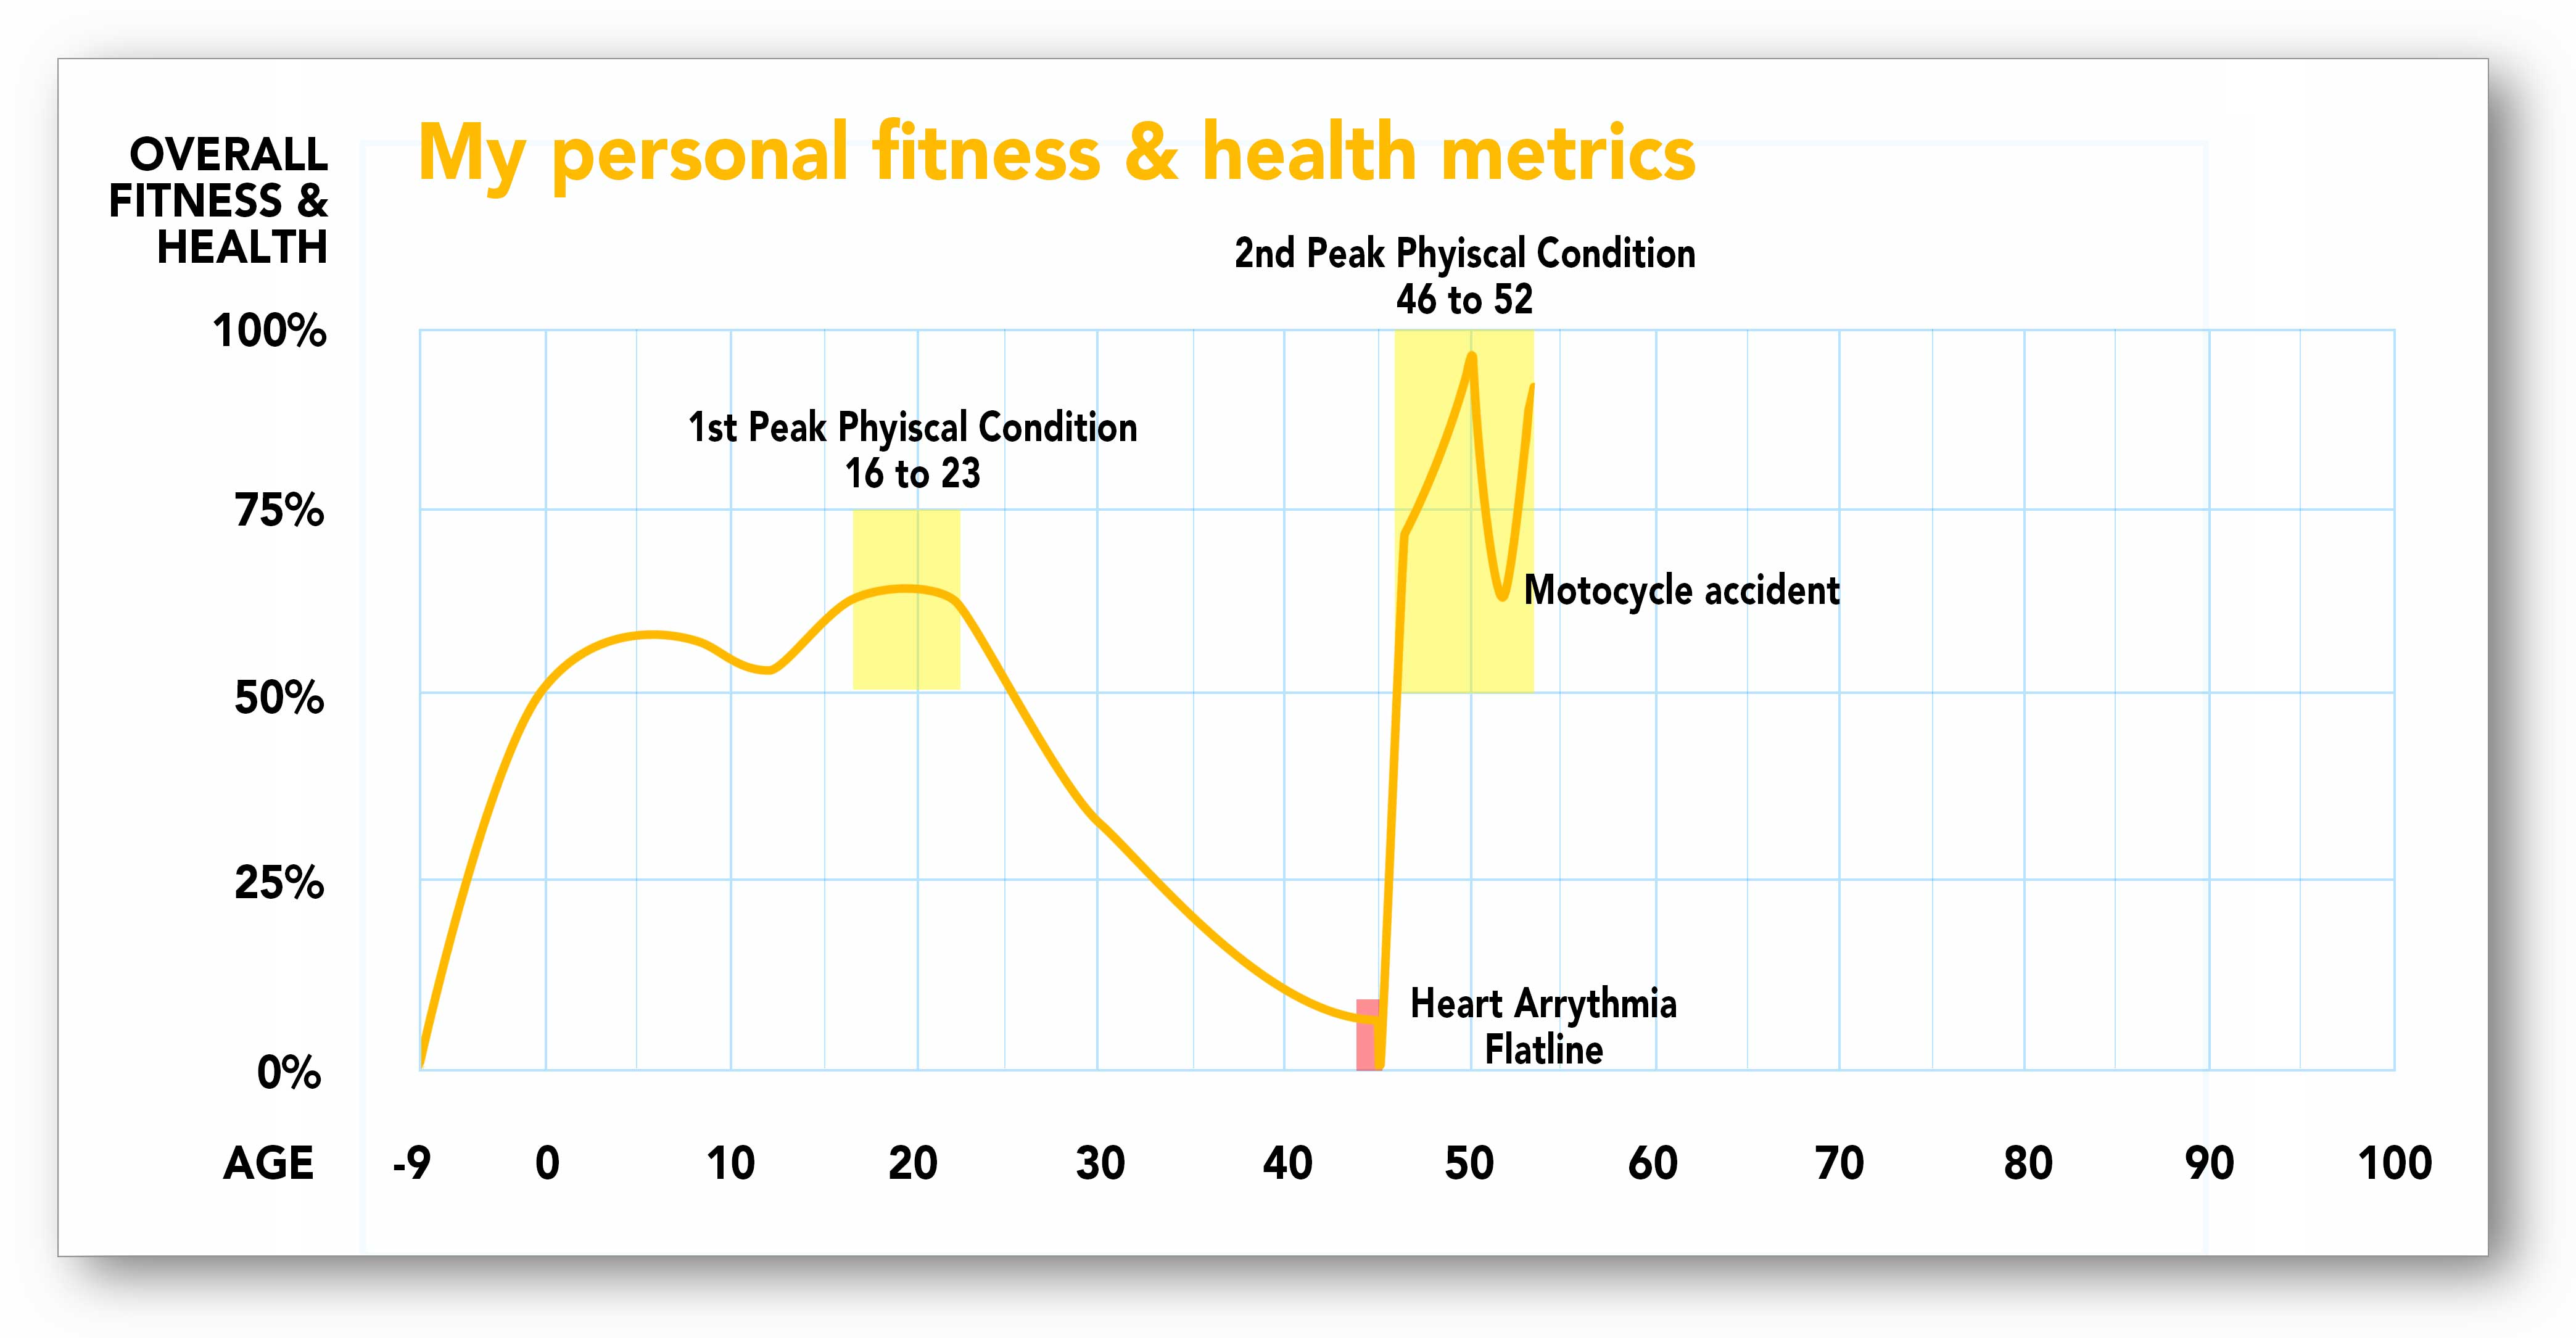
As you can see I was on the same “Reality” path as most Americans up until the age of 45 we’re I suffered a heart arrhythmia attack that flat lined me in the back of an ambulance. Then notice the dramatic change. In the span of less than 50 weeks my overall fitness and health levels rose to that of an athlete. Proving that positive change is always possible!
In the span of the next 4 years I moved into the realm of an elite athlete with peak physical conditioning approaching the highest levels in my life at the age of 49. Completely counter to the “Reality” projection.
Unfortunately, I suffered a bad motorcycle accident, which pulled my overall health and fitness downward for almost 2 years. But during the past year I have made a dramatic recovery.
So let’s examine the “Reality” graph along side “My personal” graph.
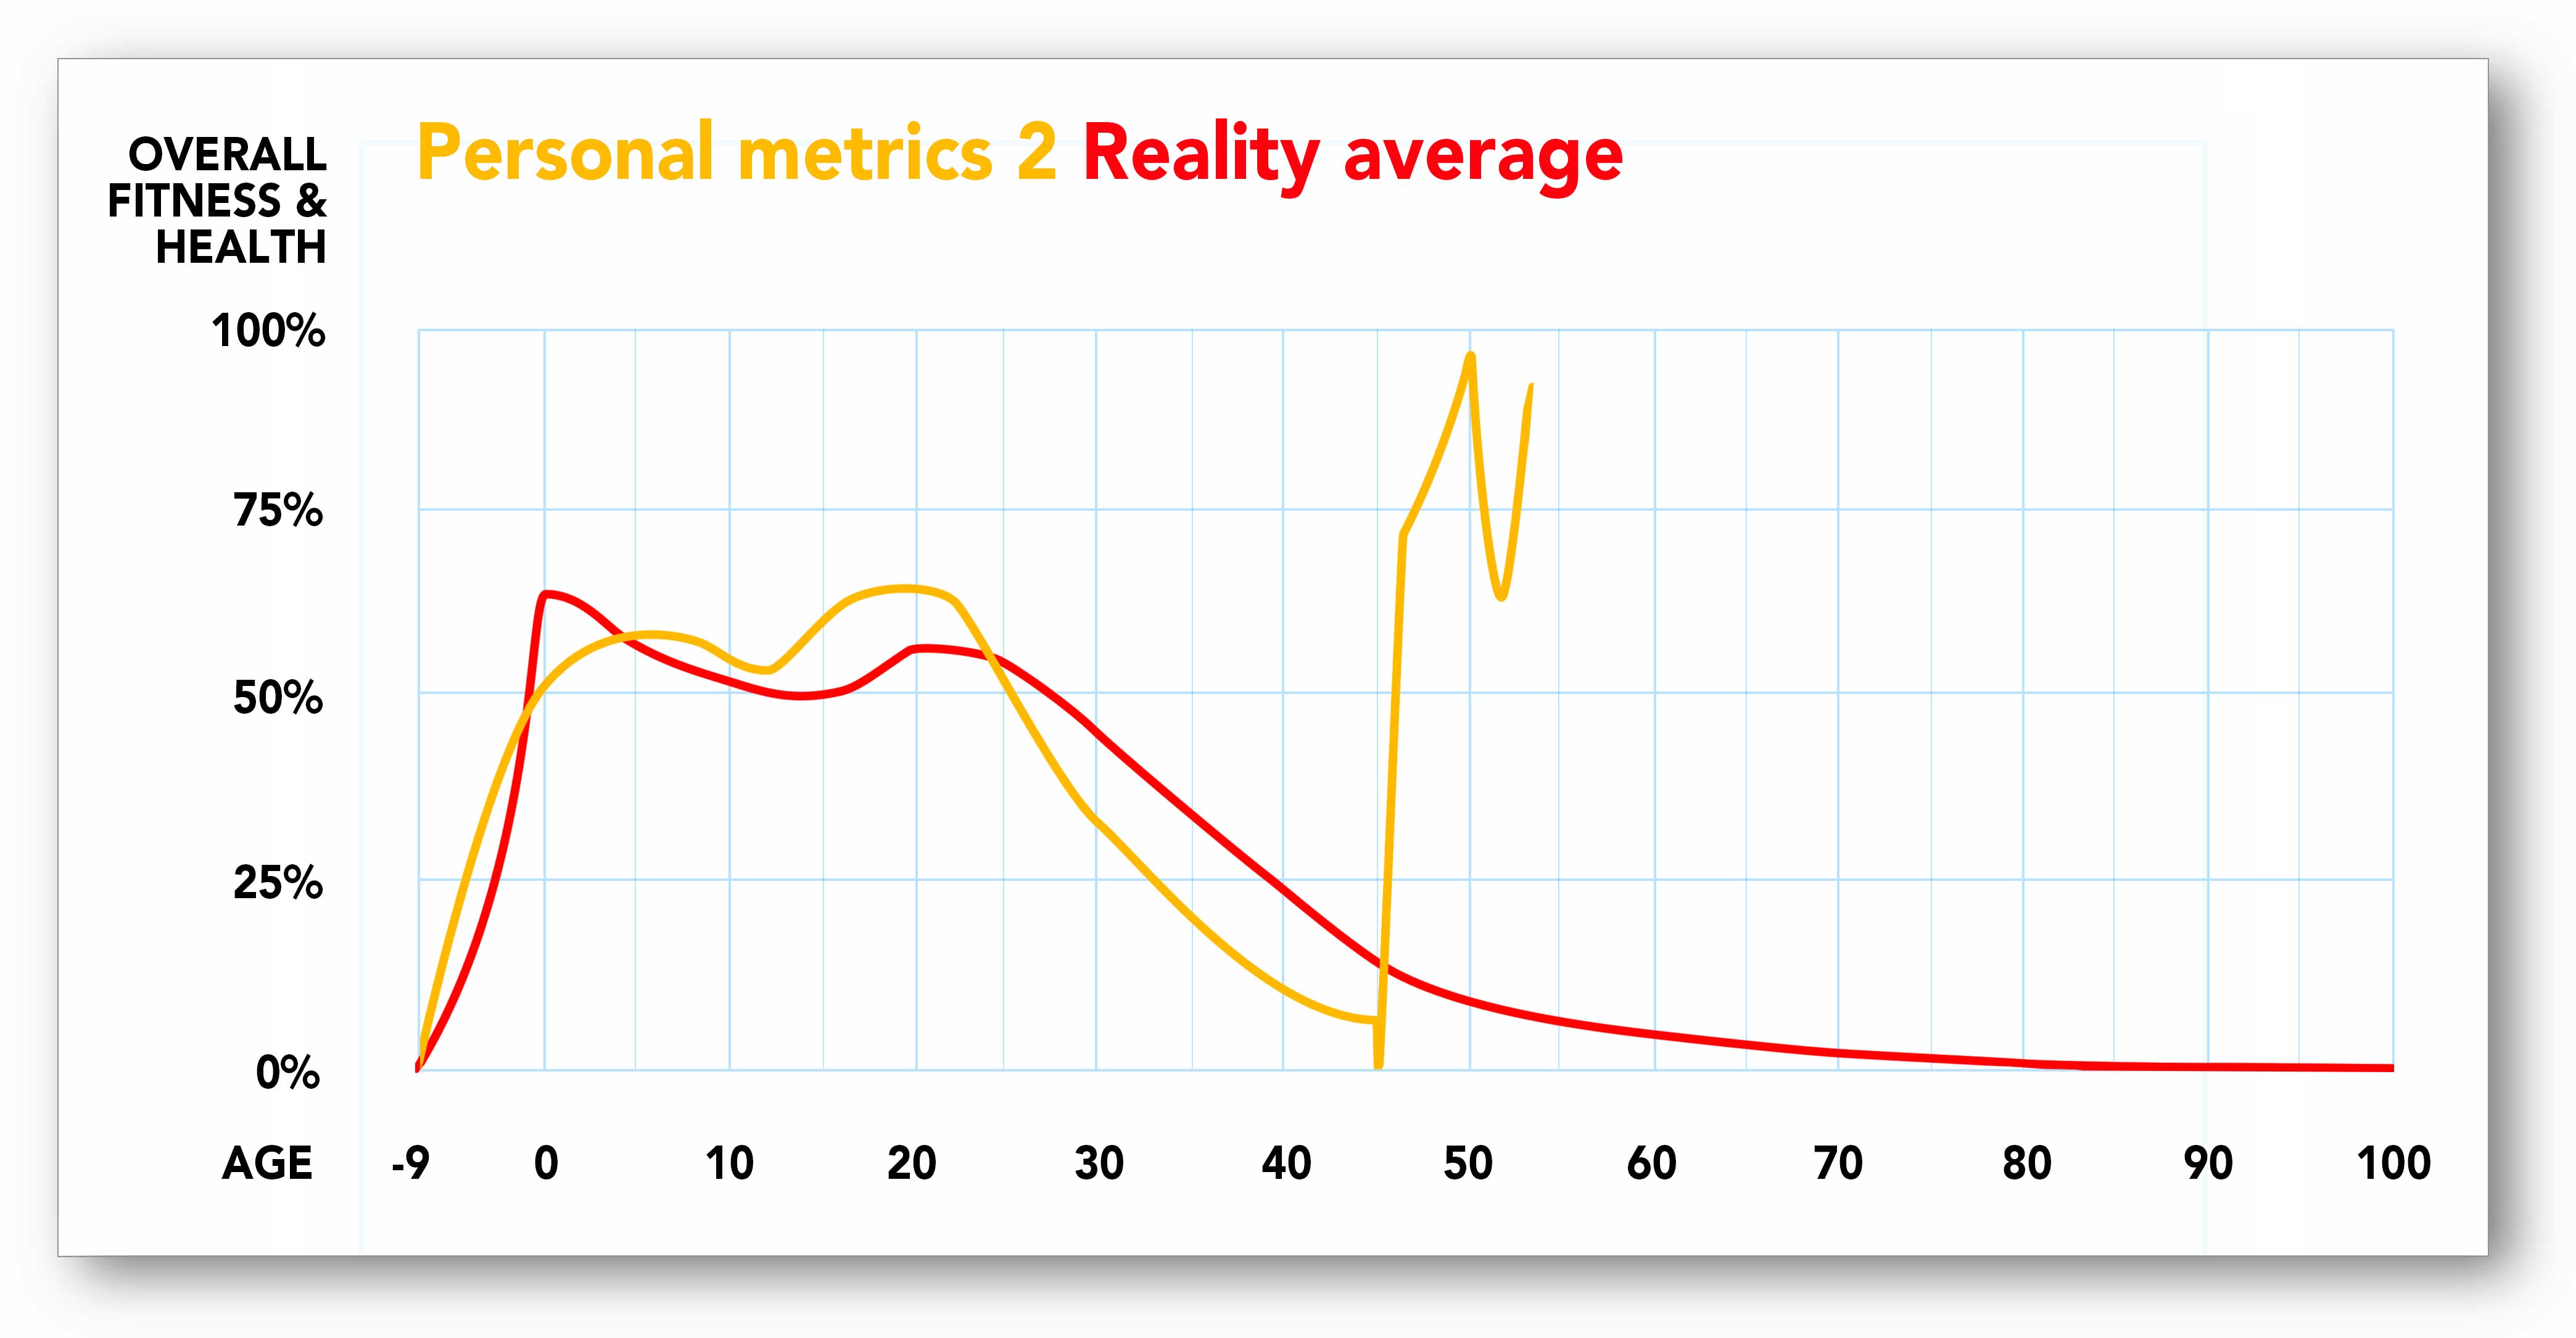
Upon review, if you had to plot out how my next 40 years of life might look compared to the “Reality” graph where would you project by outcome?
How do my odds look? Would you say I have a better chance at slowing the effects of failing health, sickness and the decline associated oncoming age? Is the possibility of me staying healthier into my golden years better than average? What would you project about my quality of life?
Metrically the answers to the above questions are a resounding GREAT! YES! SURE! AMAZING! So by “seeing” the measured things, my personal metrics – I have altered matter, my weight, my health and my attitude for the better. Can you see what an incredibly powerful tool personal metrics can be?
So here is your chance to include a new level of metrics to your life. I can assure you that you’ll be amazed at the outcome. Begin by charting your own personal fitness and health!
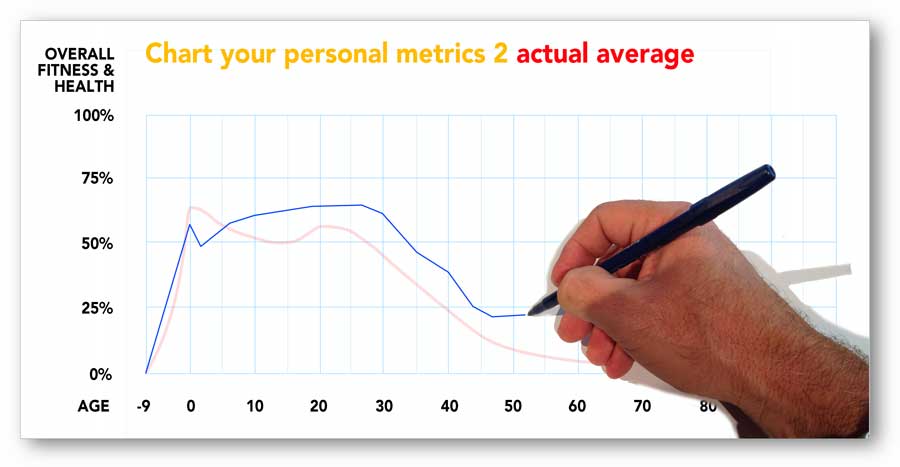
Below is a PDF of the “Reality” graph. Download it, print it out and chart your own personal health and fitness levels from birth till now. BE HONEST!
So where are you metrically? What have you discovered about yourself?
Going forward as you change your lifestyle to becoming a healthier more fit person you’ll actually begin to see the difference on your chart. You could “fine grain” this chart to monthly, weekly or daily if you so desire by charting things like weight, calories consumed, miles walked, or the number of push-ups you do and so on. Get creative and see what the metrics will reveal to you.
This actual “looking” does alter your future outcome. It’s Einstein’s “spooky action at a distance” actually shaping into your new reality.
Here are several other ways I use metrics daily.
My Nike+ Fuelband – it’s a wristband I wear that tracks my steps, calories burned and my Nike Fuel points. It links to your computer and you can follow your own progress. I love this device. – $149.00
Nike Training Club – This is a FREE app with a full workout training system on your iPhone. Step by step instructions, audio guidance and full tracking details of your workout history and progress. FREE
The latest device is another bracelet called UP from JAWBONE it measures sleep patterns, daily activity and food intake tied together with a nutritional database. -$129.99
By adding metrics into your life, I believe it will change your health outcome for the better!
For anyone interested in learning some quantum physics 🙂
* for more see the Copenhagen interpretation)
And the classic quantum physics thought experiment, Schroedinger’s Cat